How do U.S. plants save $1M/year with SQDC dashboards?
September 2, 2025
In today’s competitive U.S. manufacturing environment, every lost minute, defective part, or late shipment has a dollar sign attached to it. While most plants already have lean systems in place, many still rely on whiteboards, Excel sheets, and paper reports to track daily performance. The result? Delayed visibility, inconsistent accountability, and missed opportunities to prevent waste.
This is where SQDC dashboards come in. By digitizing the critical metrics of Safety, Quality, Delivery, and Cost, factories are transforming daily management into a real-time performance system. The results aren’t just about improved visibility—they translate into tangible financial savings often exceeding $1M per year. In this blog, we’ll break down how U.S. plants achieve these savings, real-world case examples, and a roadmap to start implementing SQDC software effectively.
What is SQDC?
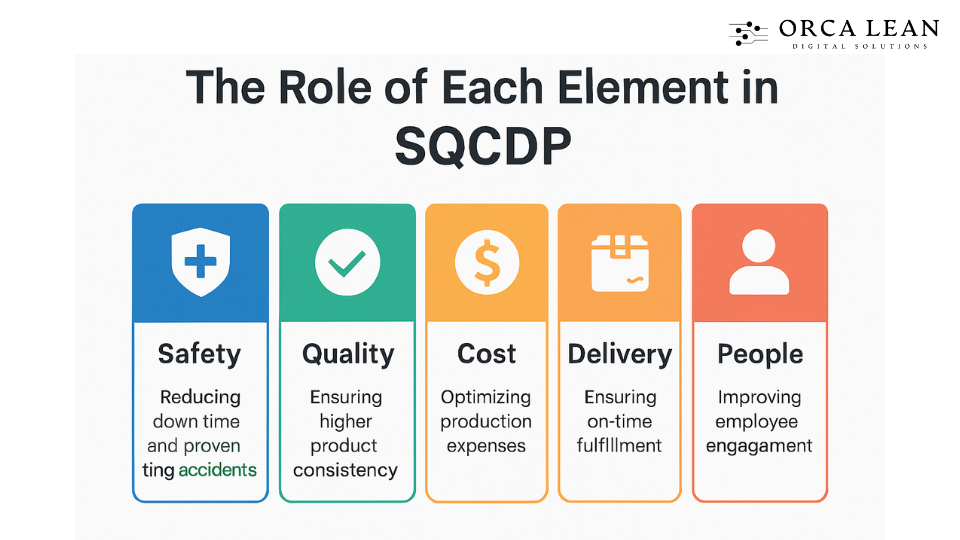
SQDC stands for Safety, Quality, Delivery, and Cost, four pillars of operational excellence that ensure plants run efficiently and profitably:
- Safety → Protecting employees and avoiding costly incidents.
- Quality → Reducing defects, scrap, and warranty claims.
- Delivery → Ensuring customer orders are fulfilled on time.
- Cost → Optimizing resources and maximizing profitability.
Traditionally, these KPIs are tracked on SQDC boards—physical boards updated during daily huddles. While effective in the early days of lean, they struggle in modern plants where real-time data is critical. A whiteboard updated once per shift doesn’t highlight problems quickly enough to prevent losses.
By moving to a digital SQDC dashboard, manufacturers can instantly visualize issues, assign owners, and track corrective actions. Instead of static numbers on a wall, leaders get a KPI scoreboard that updates in real time, driving faster problem-solving and higher accountability.
To see how these four pillars translate into daily action, check out our detailed guide on the importance of daily SQDC meetings and how they drive shop floor performance
Where Plants Lose Money Without SQDC Dashboards?
Even the best-run factories bleed money if performance isn’t tracked and acted upon in real time. Let’s look at the hidden costs that pile up when plants lack SQDC software:
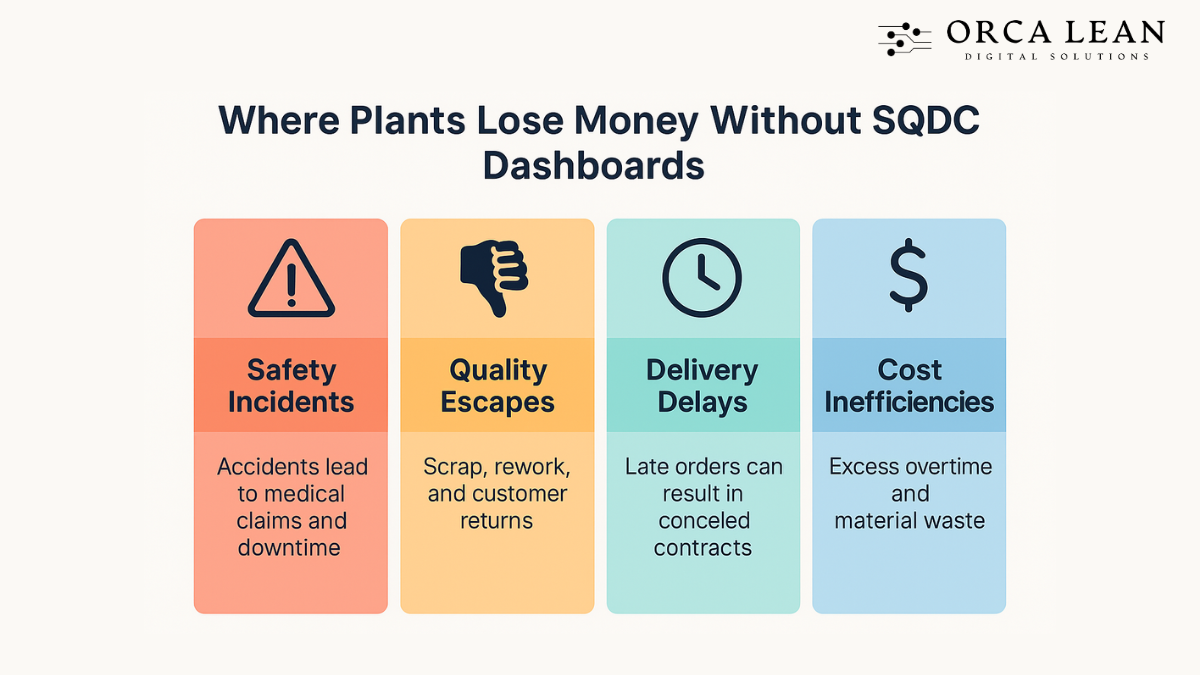
1. Safety Incidents
- Accidents lead to medical claims, downtime, and insurance premium hikes.
- Without digital tracking, near-misses and unsafe behaviors go unnoticed until a major event occurs.
2. Quality Escapes
- Scrap, rework, and customer returns quietly drain hundreds of thousands of dollars each year.
- Whiteboards can show yesterday’s numbers, but they don’t reveal where defects are happening right now.
3. Delivery Delays
- When orders run late, customers may cancel contracts or demand discounts.
- Spreadsheet tracking hides bottlenecks until it’s too late to adjust schedules.
4. Cost Inefficiencies
- Excess overtime, material waste, and poor asset utilization pile up when leaders can’t see the full cost picture daily.
- “Hidden factory” problems persist because teams lack a real-time KPI scoreboard to surface them.
In short: what isn’t measured in real time, can’t be managed. And in U.S. factories, that often translates into hundreds of thousands—or even millions—in annual losses.
To better understand why traditional tools like whiteboards fall short, check out the compelling insights in 5 Reasons Why Whiteboards Are Becoming Obsolete for SQDC Tracking in Manufacturing, where the limitations of physical tracking are laid bare.
How SQDC Dashboards Drive $1M+ in Annual Savings?
So, how does a digital dashboard convert visibility into money saved? The answer lies in cumulative improvements across all four pillars:
1. Safety
- Digital SQDC dashboards track leading indicators like PPE compliance, ergonomic checks, and near-misses.
- By addressing issues before they escalate, plants reduce reportable incidents.
- Savings Impact: A single recordable incident can cost $40,000–$60,000. Avoiding 10 incidents per year = $400K–$600K saved.
2. Quality
- Integrated manufacturing software connects inspection data, scrap counts, and defect logs directly into the SQDC dashboard.
- Operators see issues as they happen, stopping the line before defects spread.
- Savings Impact: Reducing scrap rate from 3% to 2% in a $50M plant saves ~$500K/year.
3. Delivery
- With real-time dashboards, supervisors know instantly if a line is falling behind schedule.
- Corrective actions—like reallocating labor or adjusting batch sizes—can be triggered within minutes.
- Savings Impact: Avoiding missed shipments preserves contracts worth $250K–$500K annually.
4. Cost
- SQDC dashboards reveal overtime trends, downtime losses, and material overconsumption.
- Leaders can cut unnecessary labor hours, optimize machine utilization, and reduce changeover waste.
- Savings Impact: Even a 2% reduction in overtime on a 500-person plant saves $200K/year.
Sample Calculation (mid-sized U.S. plant, 500 employees):
- Safety savings → $500K
- Quality savings → $300K
- Delivery savings → $250K
- Cost savings → $200K
Total: $1.25M in annual savings
That’s the power of a real-time SQDC software solution—small improvements across each pillar compound into seven-figure returns.
Practical Steps to Implement SQDC Dashboards
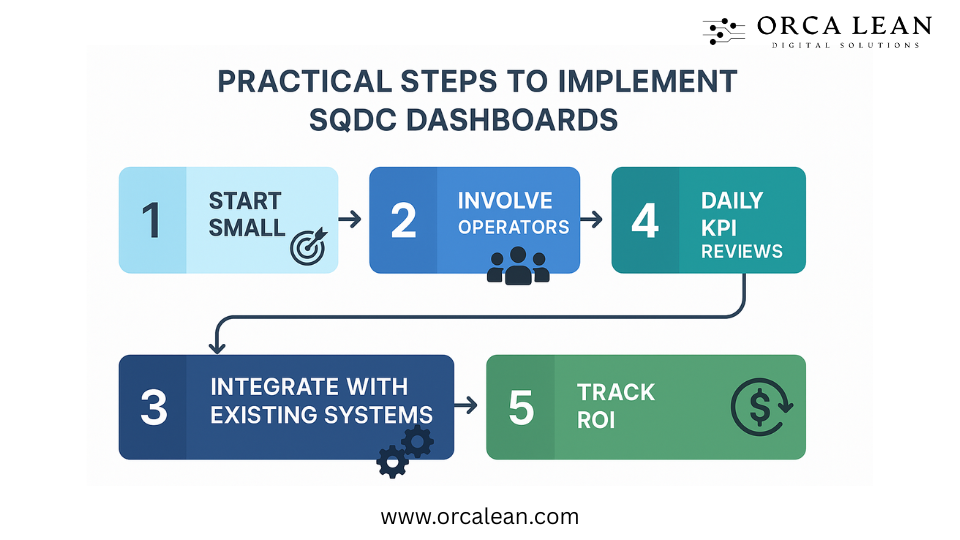
1. Start Small
Instead of attempting a full plant-wide rollout, begin with one line, cell, or department. This controlled approach helps fine-tune the system, build early wins, and minimize resistance. Once the pilot proves successful, expand gradually across shifts and plants, ensuring adoption is smooth and measurable at every stage.
2. Involve Operators
Operators are closest to the work and the first to spot abnormalities. Train them to actively use the SQDC dashboard during daily huddles, not just leadership. Their participation ensures accurate reporting, faster escalation of issues, and stronger ownership of results, which builds a culture of accountability and problem-solving.
3. Integrate with Existing Systems
An SQDC dashboard is most powerful when connected to ERP, MES, or quality management systems. Integrations eliminate manual data entry, reduce errors, and provide live updates across metrics. This creates a single source of truth, allowing managers and operators to act on accurate, real-time data rather than stale reports.
4. Daily KPI Reviews
The dashboard should be the centerpiece of daily management huddles. Leaders and operators gather to review each SQDC metric, discuss red indicators, and assign action owners. These short, structured meetings keep everyone aligned, accelerate decision-making, and reinforce discipline in tracking performance trends consistently across all shifts and sites.
5. Track ROI
From the beginning, measure impact in financial and operational terms—fewer defects, reduced overtime, safer operations, or on-time deliveries. By quantifying wins, leaders build momentum and justify further investment. Showing how the SQDC dashboard saves money makes it a long-term profit driver, not just another reporting tool.
Conclusion
In U.S. manufacturing, the difference between profit and loss often comes down to execution on the shop floor. SQDC dashboards transform daily management from a paper-based ritual into a real-time profit driver. By reducing safety incidents, cutting scrap, ensuring on-time delivery, and controlling costs, many plants are saving $1M or more annually.

The message is clear: visibility creates accountability, and accountability creates savings.
If you’re ready to stop leaving money on the table, it’s time to modernize your daily management process with FactoryKPI SQDC software. With real-time performance tracking, your plant can start capturing the savings hidden in plain sight.
Software Solutions for Manufacturing Excellence
Company
Social
Our Contact Info:
Email: contact@orcalean.com
Phone Number: 248 938 0375
Our Offices