The Most Popular Lean Six Sigma Tools and Techniques
April 3, 2025
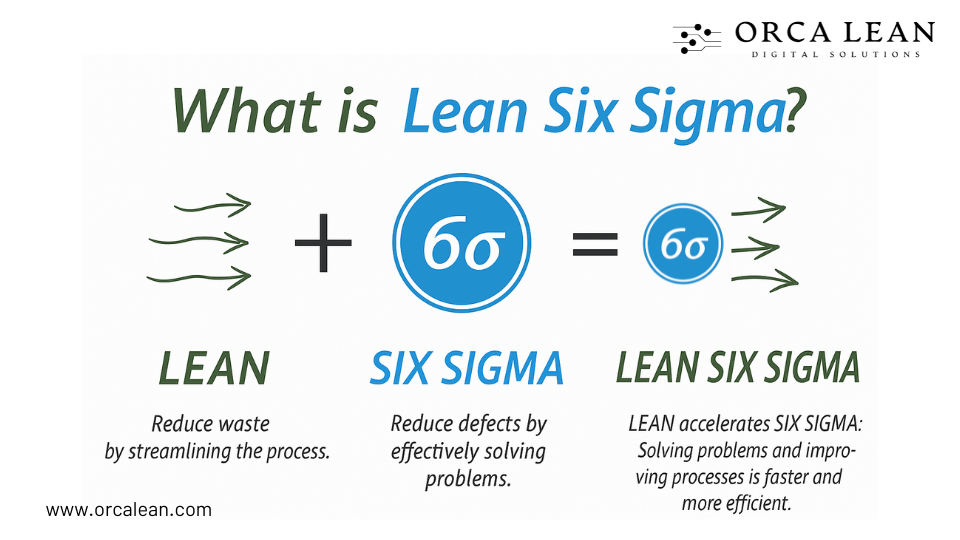
Lean Six Sigma combines Lean’s focus on eliminating waste with Six Sigma’s emphasis on reducing variation. But the real power lies in the tools it offers—practical, proven techniques that help teams improve quality, boost efficiency, and solve problems at the root. From statistical methods to visual management techniques, these tools are the everyday workhorses of continuous improvement. Whether you're streamlining a production line or solving a recurring defect issue, knowing when and how to use these tools can make all the difference.
This blog explores the most popular Lean Six Sigma tools and how they help drive real operational excellence.
Why Tools Matter in Lean Six Sigma?
Lean Six Sigma tools aren’t just fancy charts and templates—they're the backbone of structured problem-solving and process optimization. These tools help teams visualize problems, uncover root causes, measure what matters, and track progress with clarity. For manufacturing leaders, they offer a repeatable way to engage teams, validate improvements, and build a culture of data-driven thinking.
One of the key reasons tools are so vital is consistency. By using a shared toolbox across teams, everyone speaks the same language—whether it's a DMAIC roadmap, a SIPOC diagram, or a control chart. That alignment cuts confusion, speeds up collaboration, and ensures that improvements are both sustainable and measurable.
Tools also play a crucial role in knowledge transfer. When frontline teams use methods like 5 Whys or Pareto Charts, they aren’t just following orders—they’re learning to think critically and solve problems at the root. That’s how Lean Six Sigma builds capability from the shop floor up. Six Sigma also helps in improving OEE. Read our detailed blog to dive into the detailed of how six sigma improves OEE and overall productivity of a plant.
Finally, the right tool reduces ambiguity. Complex problems become solvable when they’re broken down into manageable pieces. For example, a spaghetti diagram makes physical waste visible. A fishbone diagram turns vague complaints into structured causes. And a control chart distinguishes between normal variation and true process issues.
Bottom line: without the right tools, Lean Six Sigma is just theory. With them, it becomes a powerful, hands-on system for real improvement.
Top Lean Six Sigma Tools and How They Work
Lean Six Sigma thrives on structure—and the heart of that structure is the toolbox. Each tool has a specific role depending on where you are in the DMAIC cycle (Define, Measure, Analyze, Improve, Control). Below is a breakdown of the most popular tools by function, with explanations on how they work in practice.
1. SIPOC Diagram - Maps the entire process from supplier to customer before diving into details.
How it works: Breaks down the process into five components—Suppliers, Inputs, Process, Outputs, and Customers. This high-level view aligns stakeholders and defines project boundaries.
Use case: In the Define phase, use SIPOC to avoid scope creep and ensure everyone understands the value stream.
2. Voice of the Customer (VOC) - Gathers and translates customer feedback into clear project goals.
How it works: Captures direct and indirect input (surveys, interviews, complaints) and converts them into CTQs (Critical to Quality attributes).
Use case: Ideal for aligning the problem statement with what matters most to end users.
3. 5 Whys - Helps teams drill down to the root cause of a problem.
How it works: Teams repeatedly ask “Why?”—typically five times—until the fundamental cause is uncovered.
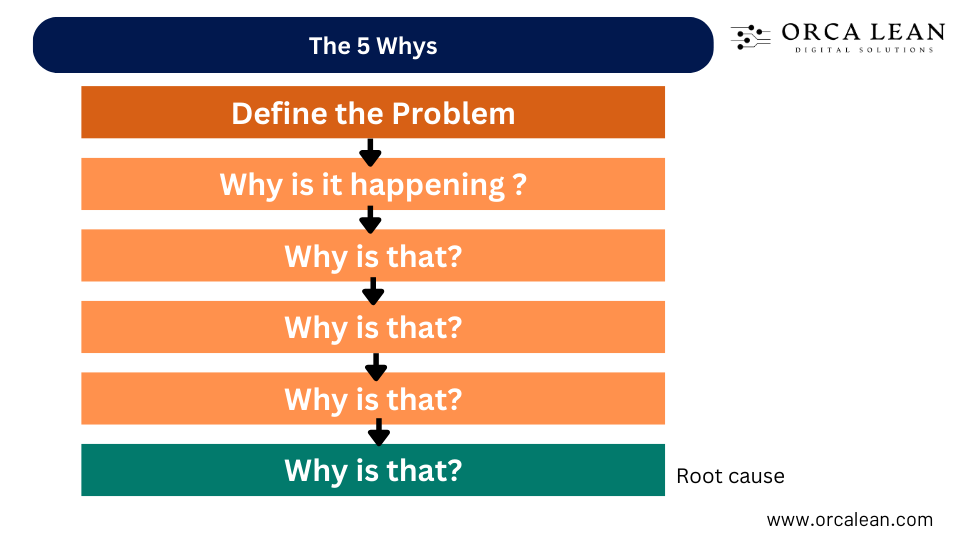
Read our blog to learn how Toyota uses 5 Whys Approach to ensure operational activities are prioritized and problem solving is improving.
Use case: Great for simple, recurring issues like repeated scrap or late deliveries.
4. Fishbone Diagram (Ishikawa) - Categorizes potential root causes visually.
How it works: Draws a "skeleton" with major cause categories (Man, Machine, Method, Material, etc.), then brainstorms sub-causes beneath each.
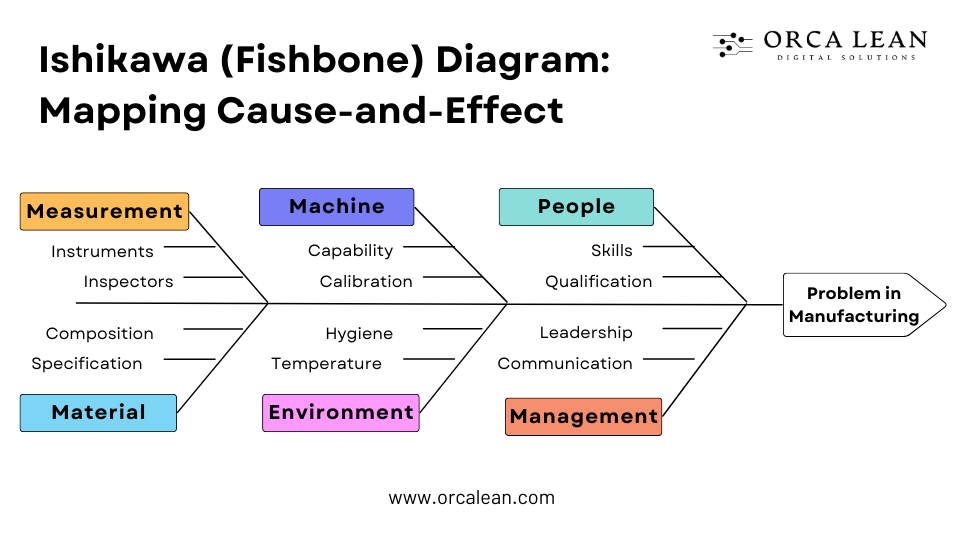
Use case: Effective when problems are complex and involve multiple factors.
5. Pareto Chart - Prioritizes problems based on frequency or impact.
How it works: Uses bar and line charts to display data in descending order, showing which causes contribute most to the issue.
Use case: Focuses efforts on the “vital few” instead of the “trivial many.”
6. Value Stream Mapping (VSM) - Visualizes the end-to-end process to identify waste.
How it works: Maps every step from raw material to finished product, labeling value-added and non-value-added steps, cycle times, and delays. Value Stream Mapping also helps in reducing lead time by mastering the art of value stream analysis—from current state mapping to targeted, data-backed improvements.
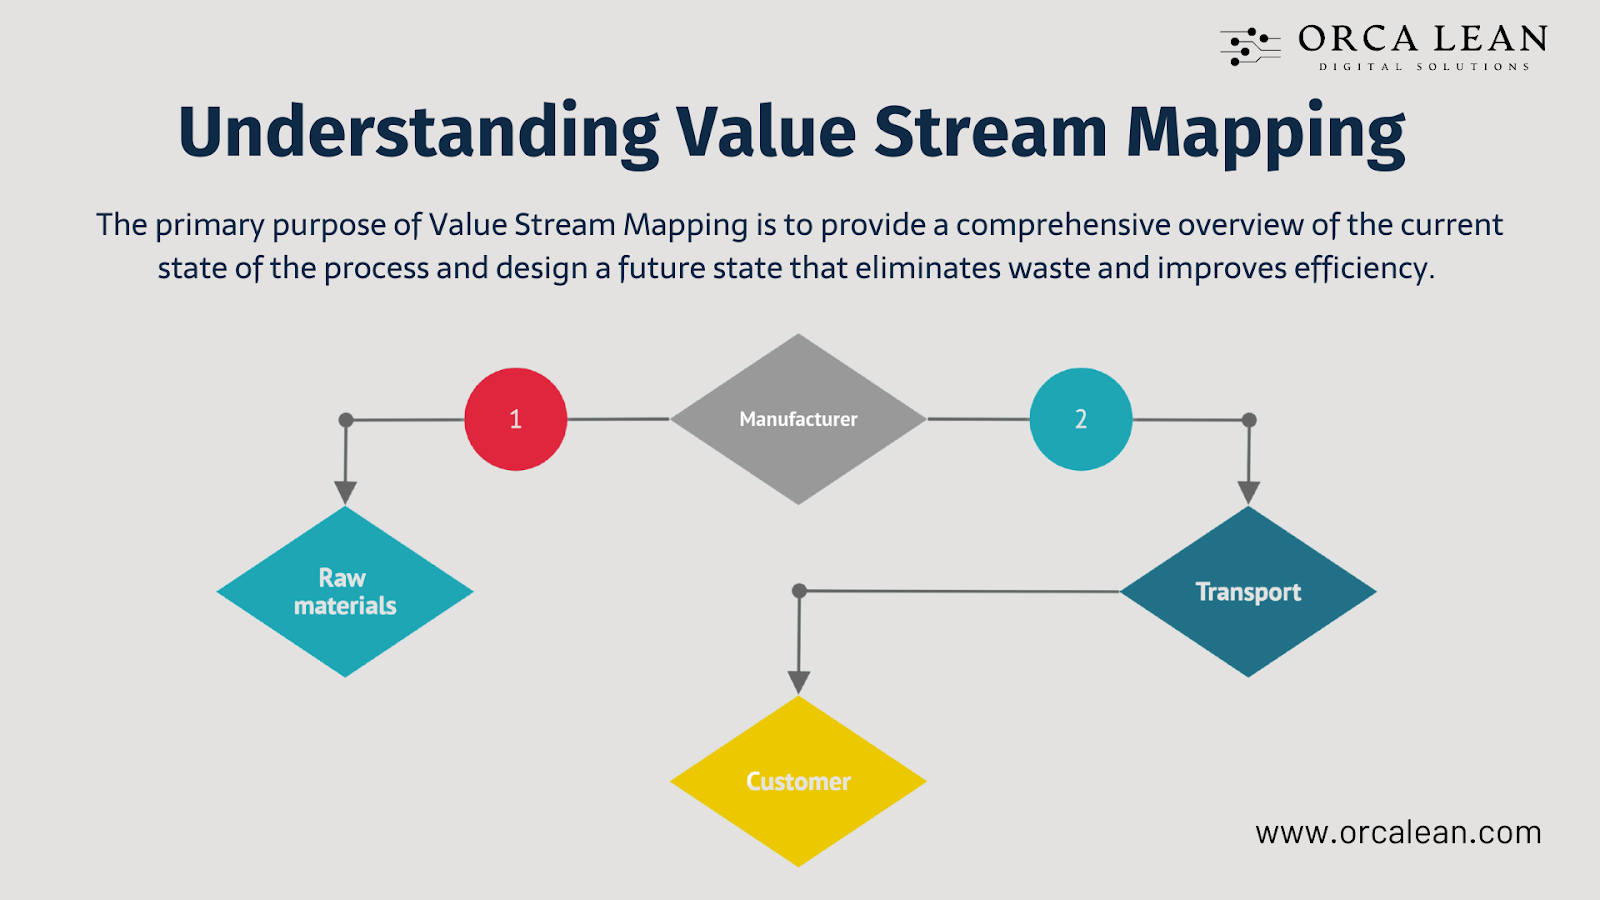
Use case: Ideal for spotting bottlenecks, excessive inventory, or long lead times.
7. Spaghetti Diagram - Highlights motion waste in physical environments.
How it works: Tracks actual movement of people, tools, or materials to expose inefficient layouts.
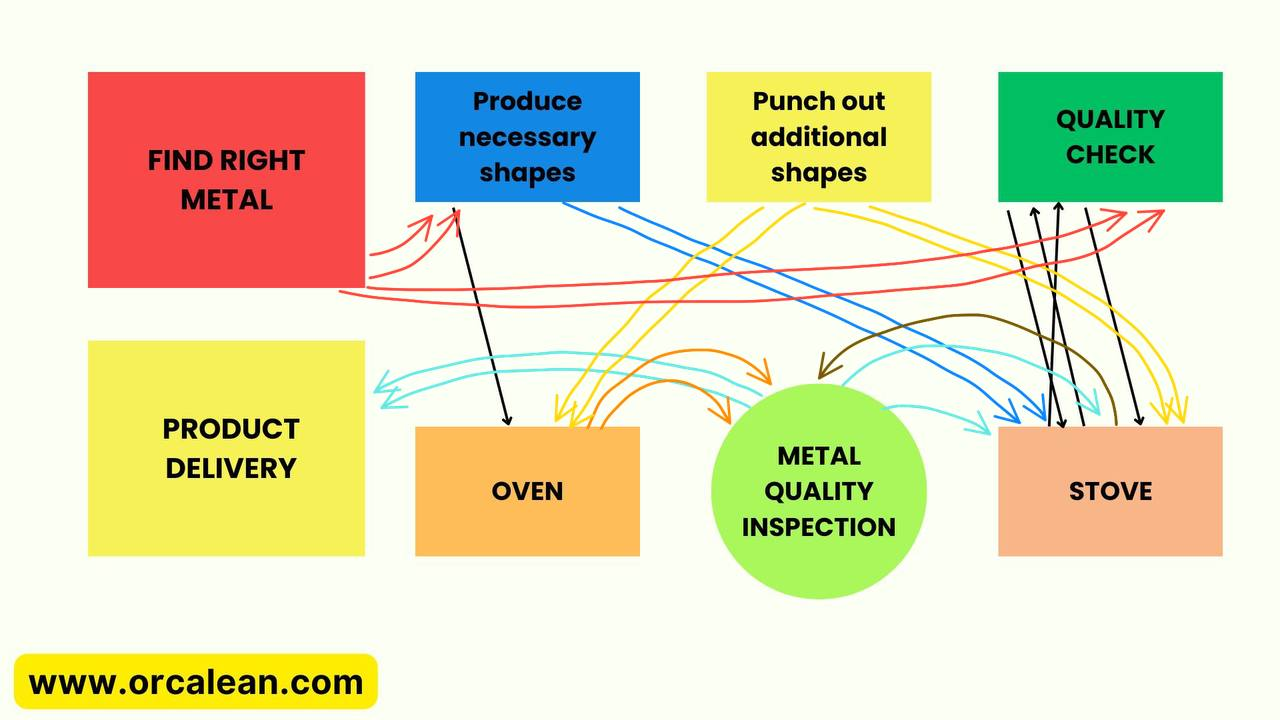
Use case: Useful in factories or workstations where employees walk long distances unnecessarily.
8. Swimlane Diagram - Shows how processes flow across departments or roles.
How it works: Each horizontal lane represents a function or role. Tasks are mapped in sequence to show handoffs.
Use case: Reveals delays caused by unclear ownership or cross-functional gaps.
9. Histogram - Displays the distribution of data.
How it works: Breaks data into intervals (“bins”) and shows how many values fall into each.
Use case: Helps identify whether a process follows a normal distribution or has outliers.
10. Box Plot - Summarizes data variation and detects outliers.
How it works: Shows the median, quartiles, and extremes of a dataset in one chart.
Use case: Ideal for comparing different shifts, suppliers, or machines.
11. Scatter Plot - Shows relationships between two variables.
How it works: Each point represents a data pair, helping detect correlations or trends.
Use case: Useful in root cause analysis—for instance, linking machine temperature to defect rates.
12. Control Chart - Monitors process stability over time.
How it works: Plots a variable over time with upper and lower control limits. Points outside limits or patterns within them signal special causes of variation.
Use case: Essential for sustaining improvements and avoiding false alarms.
13. FMEA (Failure Modes and Effects Analysis) - Identifies potential failure points and ranks their risks.
How it works: For each step or component, assess Severity, Occurrence, and Detection scores. Multiply them to calculate a Risk Priority Number (RPN).
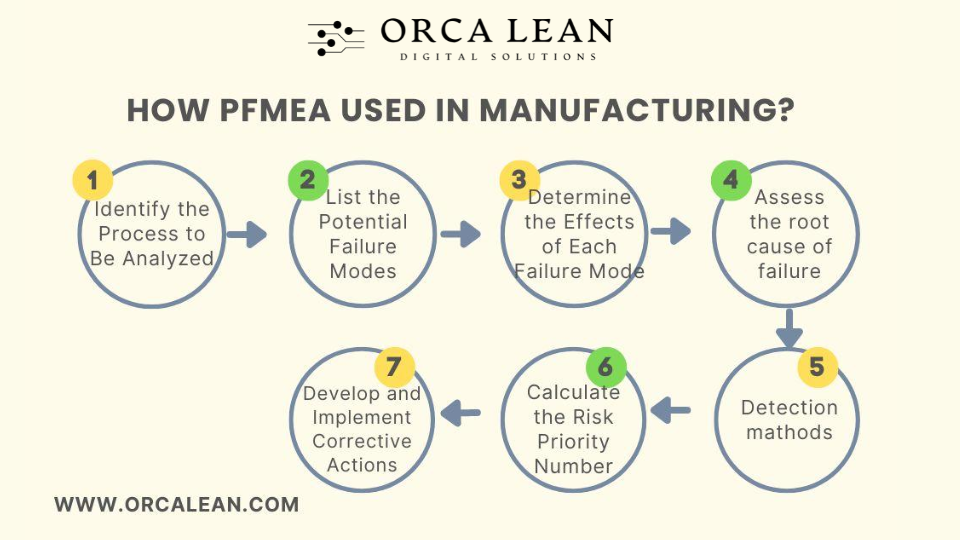
Use case: Proactively prevents issues in design, process changes, or new product launches.
14. PICK Chart - Helps teams select ideas with high impact and low effort.
How it works: A 2x2 matrix with axes for ease of implementation and potential impact. Classifies actions as Possible, Implement, Challenge, or Kill.
Use case: Efficient for Kaizen events or when many solutions are on the table.
15. Impact/Effort Matrix - Prioritizes projects or actions based on ROI potential.
How it works: Plots initiatives on a matrix to focus on quick wins and long-term gains.
Use case: Guides resource allocation in Lean Six Sigma project selection.
16. Control Plan - Documents how improvements will be maintained.
How it works: Lists key variables to monitor, responsible parties, acceptable ranges, and response actions.
Use case: Required in the Control phase to ensure gains stick.
17. Standard Work - Defines the best known method for performing a task.
How it works: Documents sequence, timing, and content for every process step.
Use case: Reduces variability and forms the baseline for continuous improvement.
18. Visual Management - Makes process performance visible in real time.
How it works: Uses signs, color coding, KPI boards, or Andon systems to show status, alerts, or deviations.
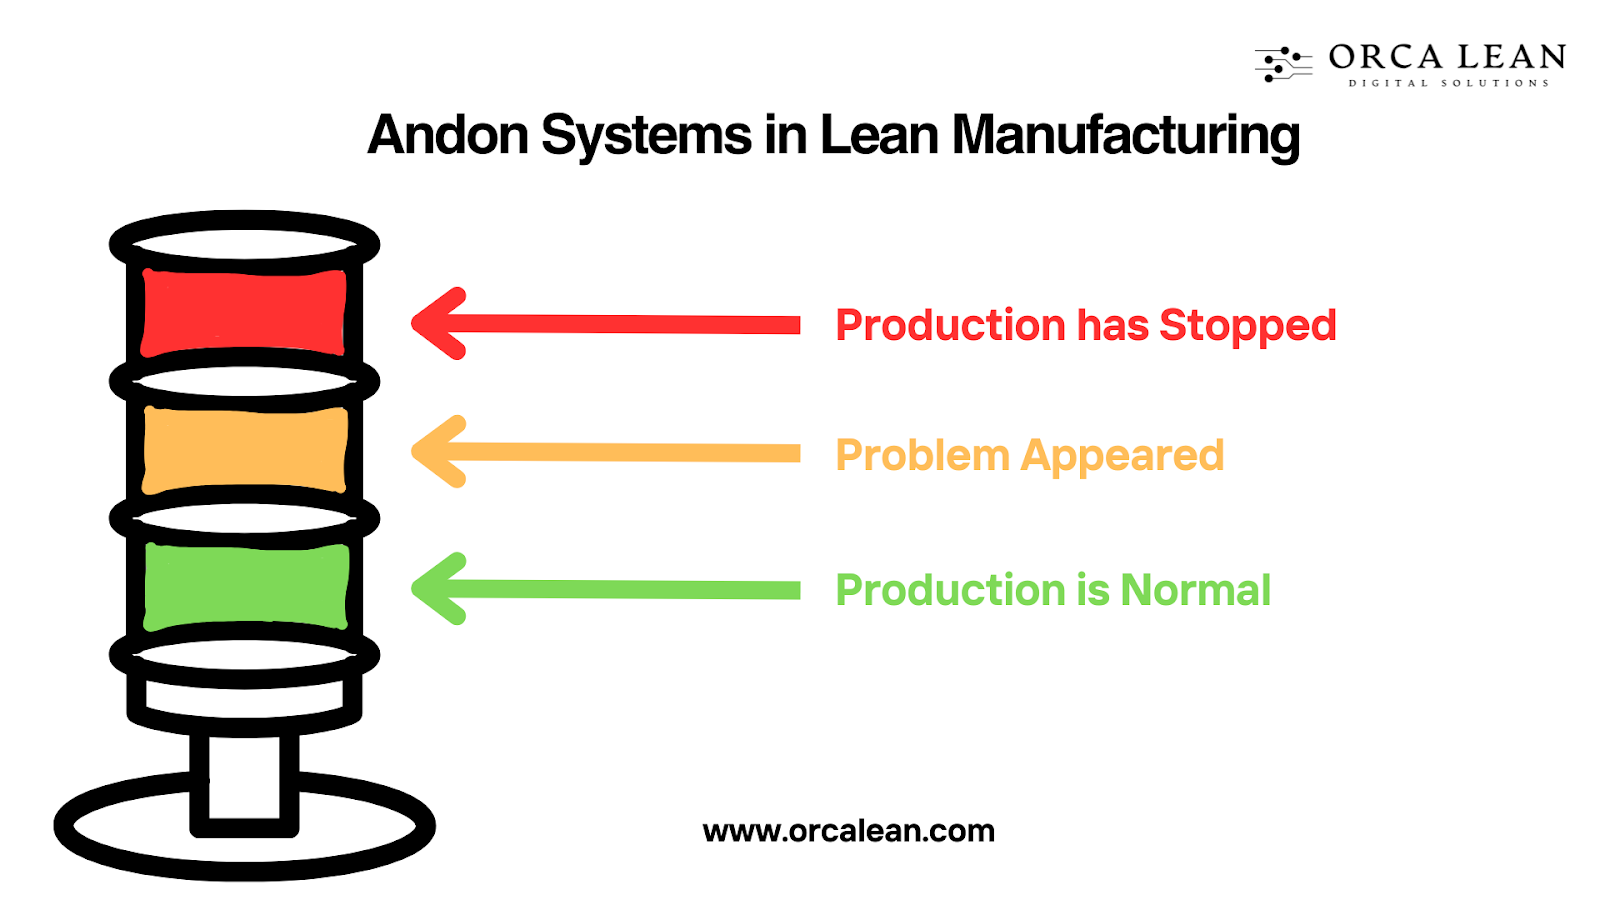
Use case: Empowers frontline workers to act quickly and stay aligned with targets.
These tools don’t just solve problems—they build problem-solving capability across the organization. The more fluently your team can use them, the faster and more sustainably your improvements will take hold.
How to Choose the Right Tool?
Selecting the right Lean Six Sigma tool isn't guesswork—it’s about aligning the tool with your goal, your available data, and your team’s capability. For instance, if you're trying to reduce variation in a process with measurable output, statistical tools like control charts or histograms are ideal. But if you’re still figuring out the problem, a SIPOC diagram or Voice of the Customer (VOC) can provide much-needed clarity.
One common mistake? Overcomplicating the approach. You don’t need regression analysis when a simple 5 Whys will do. The key is to match the tool to the complexity of the problem—nothing more, nothing less. Equally important is your team’s familiarity. Tools only work if people use them confidently. Introducing tools gradually, using visual templates, and embedding toolkits into workflows can accelerate adoption and results.
The DMAIC framework provides a helpful roadmap for tool selection:
- Define: SIPOC, VOC
- Measure: Process Maps, Control Charts
- Analyze: Fishbone Diagram, Pareto Chart, 5 Whys
- Improve: FMEA, PICK Charts
- Control: Control Plans, Standard Work
Ultimately, choosing tools isn't about ticking boxes—it’s about finding leverage points. The right tool helps you cut through complexity, focus your team, and move the needle on cost, quality, and throughput. And when your team is supported by smart factory digital solutions that embed these tools into daily routines, continuous improvement becomes second nature.
Conclusion
Lean Six Sigma tools are more than templates—they’re enablers of cultural change. When used correctly, they turn frontline teams into problem-solvers and everyday operations into opportunities for improvement. From spaghetti diagrams to FMEAs, these tools provide the structure and clarity needed to drive lasting results.
If you want these tools to work at scale, they need to be simple, accessible, and embedded. That’s where Solvonext comes in. Our software puts Lean Six Sigma tools at your team’s fingertips—digitally, visually, and in real time.
Ready to make continuous improvement your competitive advantage? Book a demo with Solvonext.
Software Solutions for Manufacturing Excellence
Company
Social
Our Contact Info:
Email: contact@orcalean.com
Phone Number: 248 938 0375
Our Offices