The 70-20-10 Rule of Process Adherence: Statistical Patterns in Operator Behavior
November 17, 2025
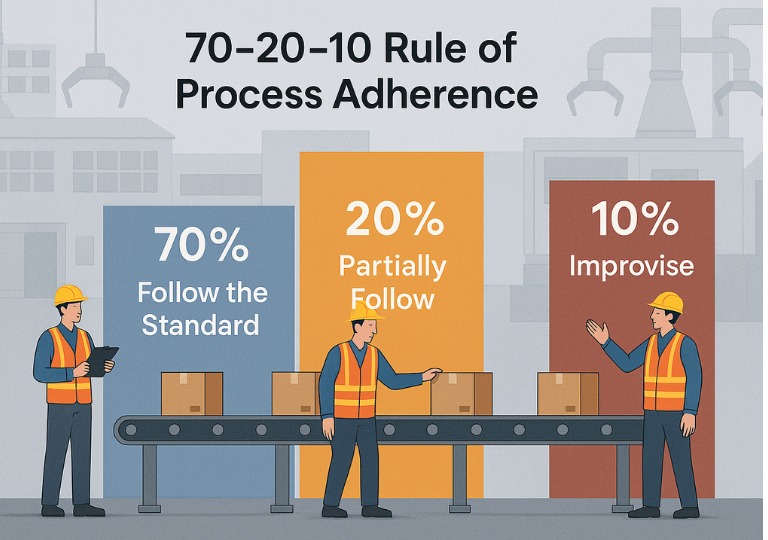
In almost every factory where standard operating procedures (SOPs) are clearly defined, you will observe a paradox: despite identical instructions, outputs vary. Some operators follow the standard method to the letter; others partially follow; and a small but persistent group improvises regularly. A useful heuristic to describe this distribution is the “70-20-10” rule: roughly 70% of operators adhere fully to the standard, 20% follow partially, and 10% improvise or deviate significantly.
Why does this matter for leadership?
Because process stability, defect reduction and continuous improvement depend not just on having the standard, but on ensuring the distribution of operator behaviour is managed. If 10% of the workforce is routinely deviating, that becomes a vector of variation, scrap, rework and hidden cost.
In effect, you must treat adherence as a statistical variable — similar to machine variation — rather than simply as a compliance checkbox. The goal: shift that 70 % leftwards towards 90-100 % adherence, reduce the 20 % “gray area” and shrink the 10 % deviant tail.
Is the 70-20-10 pattern just a coincidence — or a statistical reality?
Though few published studies explicitly say “70-20-10 adherence,” there is robust evidence that human behaviour in process environments forms consistent distributions, and deviations from standards in manufacturing are common.
Evidence and analogues:
- A case-study in semiconductor manufacturing found dispatch-compliance (i.e., operator adhesion to schedule decisions) typically ranged from 55% - 68 %. ResearchGate
- An investigation of deviations in production processes under Industry 4.0 found that companies treat “deviation from standard work” as a major issue. DIVA Portal
- In manufacturing broadly, a survey found 70% of manufacturers still collect data manually, implying that digital controls and automated adherence monitoring are still weak — reflecting human variation in process tracking. The Manufacturing Leadership Council
- In the compliance field (broadly outside manufacturing), one study reports that 70% of risk and compliance professionals observed a shift from checkbox-compliance to strategic compliance. Secureframe
- In another study, firms spend on average 1.3 %–3.3 % of their wage bill on regulatory compliance tasks. Drata
These data points demonstrate three things: (1) human adherence to standards is significantly less than 100 %; (2) there is measurable variation and “tail-behavior”; (3) the management of such behavior remains an under-invested area.
The “70-20-10” pattern is therefore a useful approximation for leadership purposes rather than a precise universal constant. Its power is in providing a framework: most comply, some partially, some improvise. The key is measuring and shifting the distribution.
What drives these behavioral deviations on the shop floor?
Why does that 20 % + 10 % exist? What causes one operator to follow the standard and another to stray? Three categories of root-cause drive distribution behaviour:
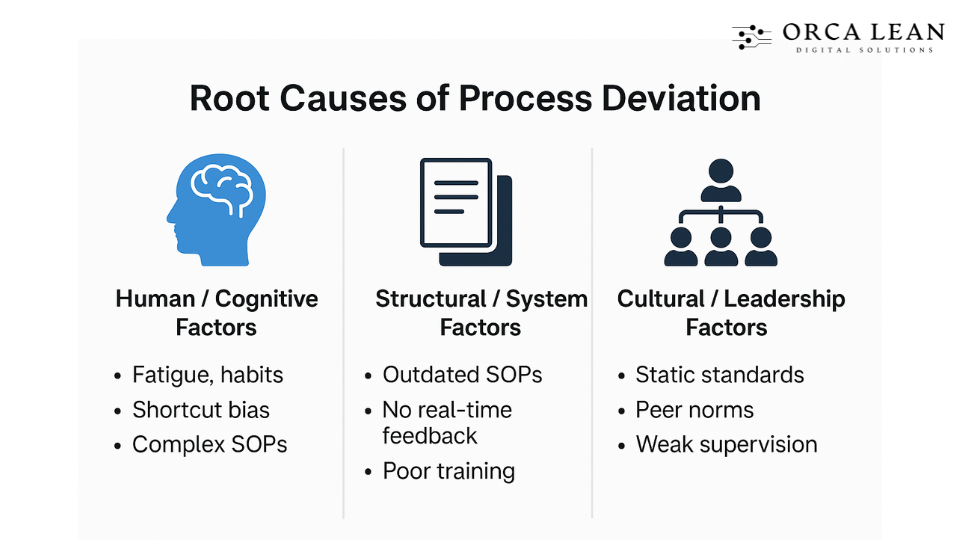
a) Human / cognitive factors
- Fatigue, distraction, habit and shortcut bias all contribute. An operator may know the standard but fall back on “how I’ve always done it”.
- As the learning-curve flattens, the standard becomes tacit and deviation increases. (See e.g., operator learning-rate studies.) For example, a 2024 study on operator allocation found a standardized learning-rate of ~93 % and fatigue index of 0.20 across tasks, indicating that small human factors still introduce variation. MDPI
- Cognitive overload: when the SOP is too complex, ambiguous or disconnected from floor reality, operators will default to familiar shortcuts.
b) Structural / system factors
- SOPs that are outdated or not aligned to actual conditions degrade adherence. In one article, many U.S. factories failed standard work because the instructions were disconnected from the floor. Orcalean
- Lack of real-time feedback or measurement means deviations are not visible or corrected quickly, so the 10 % tail persists.
- Poor training, high turnover, and lack of reinforcement create the condition where the “standard” is not executed consistently.
c) Cultural / leadership factors
- If leadership treats standard work as a static document rather than a living system, adherence falls.
- Peer behaviour sets norms: if a small group regularly deviates without consequence, that becomes an accepted local “normal”.
- Coaching and auditing: Without supervisory reinforcement and feedback loops, the 20 % partial-adherers continue drifting and the 10 % deviators remain unchecked.
Together, these factors create a distribution of behaviour. The 70 % full-adherers are those working within the system design, the 20 % are operating but with deviations (grey-zone), and the 10 % are improvising — often hidden but highly impactful in terms of variation, scrap, rework and unpredictable outcomes.
How can leaders shift the 70-20-10 curve toward 90-10-0?
Shifting the behavioural distribution is a leadership and systems challenge — not just a training task. Here are statistically-oriented, data-driven interventions:
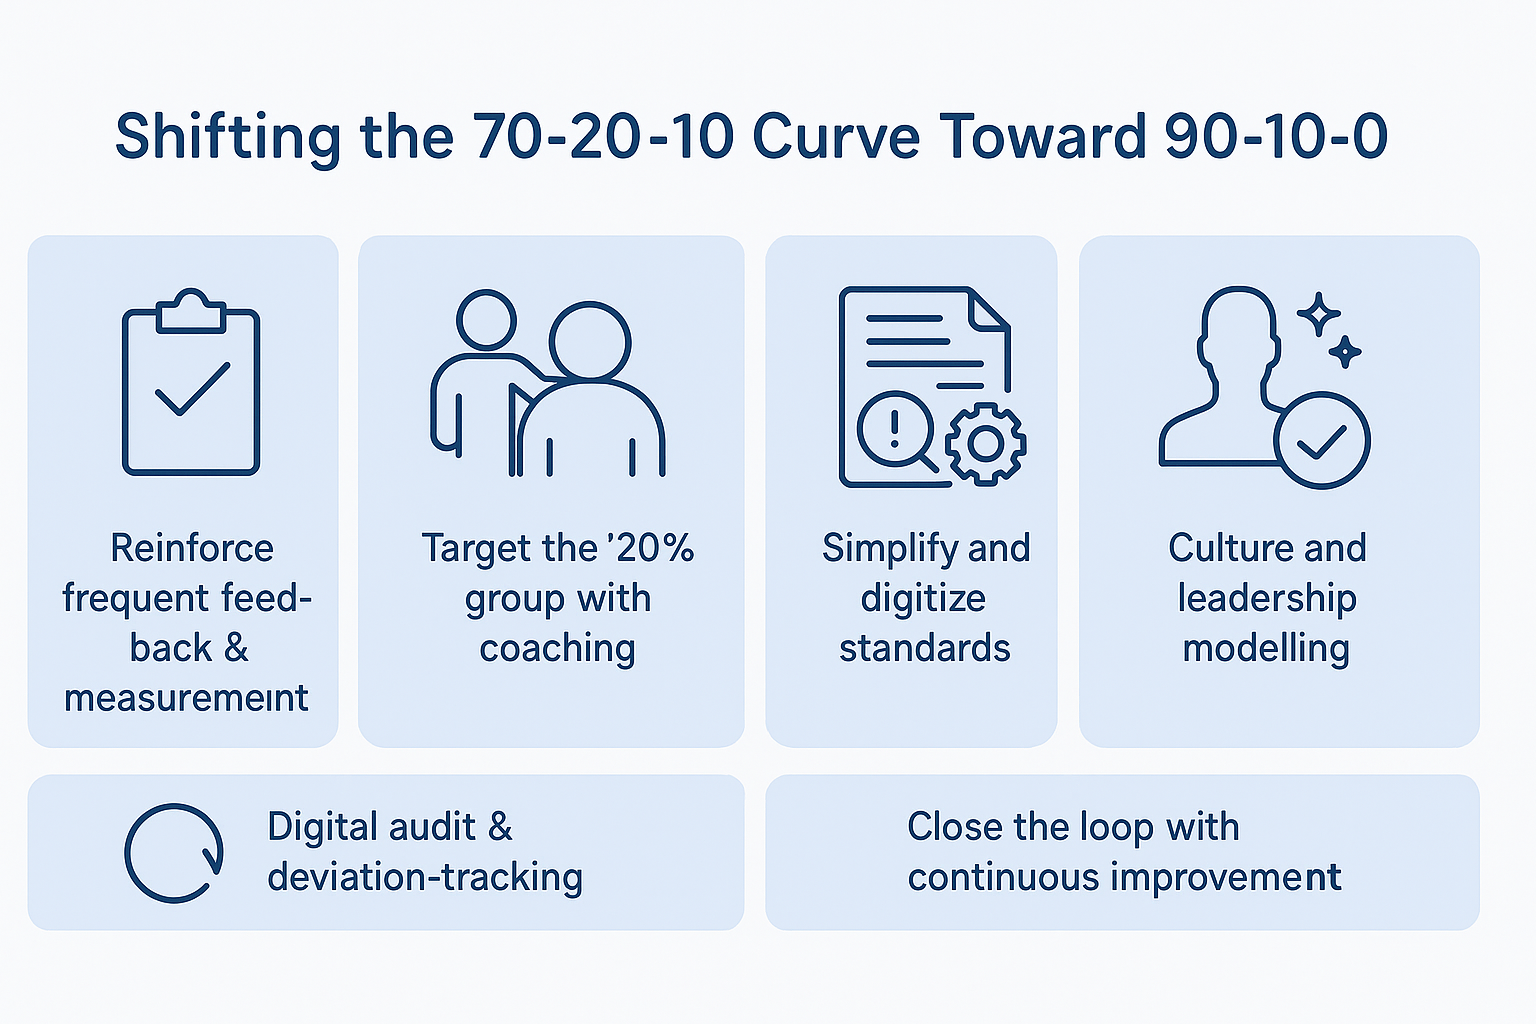
• Reinforce frequent feedback & measurement
Make adherence visible: use digital tools (tablets, dashboards) where operators and supervisors can see adherence metrics in real time. Frequent micro-feedback reduces drift. For example: spaced training has been shown to increase learning retention up to +88 %. foodengineeringmag.com
• Target the “20%” group with coaching
The 20 % who partially follow standards are the high-leverage group. Focus coaching on why they deviate — is it because the SOP is ambiguous, too long, or misaligned with floor realities? Provide supervision and mentor-walks rather than just audits.
• Digital audit & deviation-tracking
Deploy measurement systems that capture when standards are not followed. Like behavioural SPC: track deviation frequency, severity, repeat offenders. Turn data into targeted action rather than broadcast alarms. The earlier semiconductor study showed performance gaps when operator compliance was ~55–68 %. ResearchGate
• Simplify and digitize standards
SOPs should be co-created with operators (not just engineers) and delivered in formats they use (videos, tablets) so that the standard is realistic and accessible. Studies show U.S. factories often fail standard work because instructions were disconnected from the floor. Orcalean
• Culture and leadership modelling
Senior leadership must treat adherence as a KPI — not just quality or throughput. Make deviations visible, reward adherence and improvement, embed adherence into performance metrics. Use control-chart thinking: treat operator adherence as you treat process drift.
• Close the loop with continuous improvement
Every deviation must trigger root-cause review: is this a training issue, a design issue, or a culture issue? Use standard work itself as the baseline and update it when necessary. Standard work is not static; it must evolve. The earlier study of standardization in construction showed that standard work can reduce variability significantly. ResearchGate
By systematically applying these interventions, you can shift the distribution: increase the size of the 70 % (full adherence) to 90 %+; reduce the 20 % partial to a smaller cohort; and shrink the 10 % improvisers to near zero.
Conclusion
In manufacturing, excellence isn’t defined by how many SOPs exist—it’s defined by how consistently they’re followed. The 70-20-10 rule exposes a truth every leader must confront: variation in operator behavior drives variation in results. By measuring, visualizing, and coaching adherence as a statistical variable, you can shift the curve toward predictable, high-yield performance. The difference between 70% and 90% adherence isn’t incremental—it’s exponential in impact.
Explore how Standard Work Pro by OrcaLean helps leaders digitize, monitor, and continuously improve operator adherence—turning standard work from documentation into a living performance system.
Software Solutions for Manufacturing Excellence
Company
Social
Our Contact Info:
Email: contact@orcalean.com
Phone Number: 248 938 0375
Our Offices